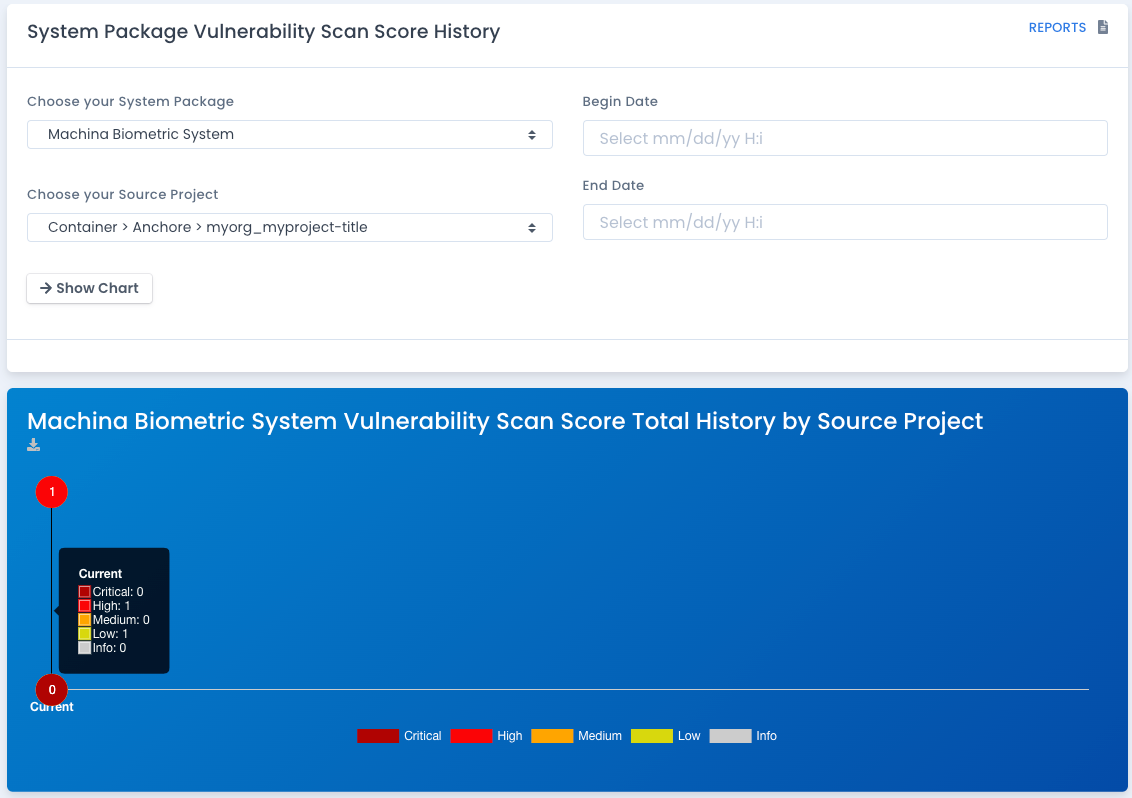
Run the Other Vulnerability Source Project Chart
This report shows the vulnerability data score from technology scans for software, container, log, or other/custom data by type. Specify the source project as well as dates, and then click Show Chart to generate the chart matching those criteria. Click the download link to download a JPG version of the chart.
Where the Data Comes From
This data is an accumulation of all technology vulnerability scans scores from uploaded/imported into the system package in total, by category, and by category/source/project as well.
As you upload *.json files or import more data, it adds new vulnerability data, updates older ones, and updates the vulnerability data score. The scores are tracked and shown in these charts.
Why Generate these Charts
To know the total open vulnerability scores for technology vulnerability data visually by each source project, you would generate this chart. You also can export the charts to JPG for reports, briefings, status updates, and the like.