Checklist Dashboard
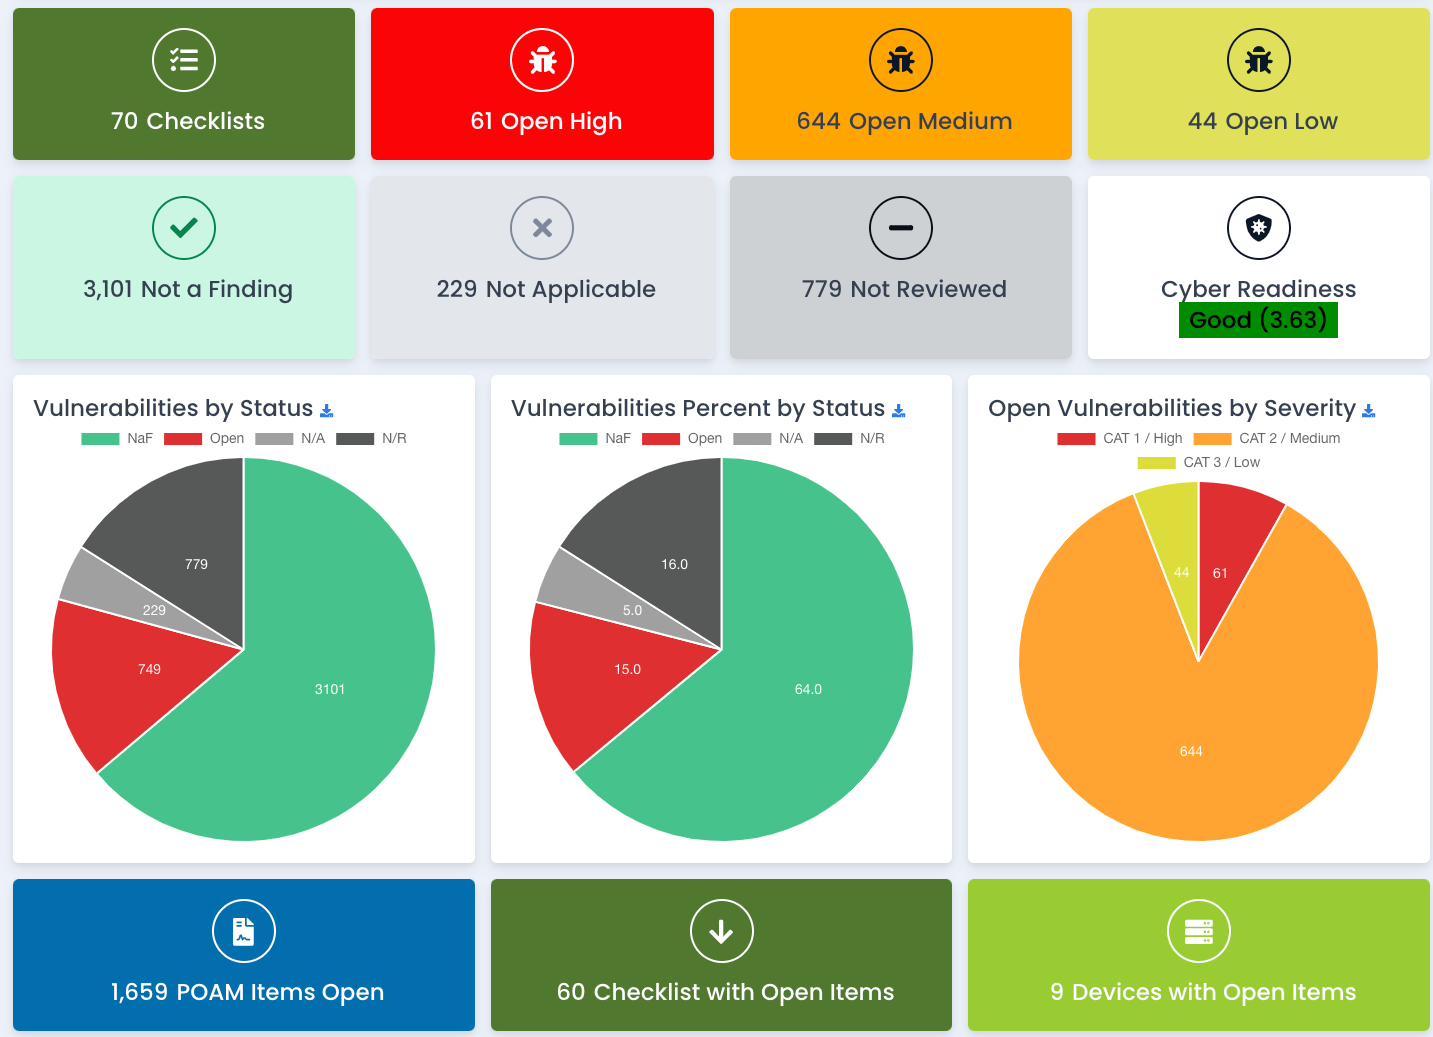
The Checklist Dashboard shows visually the total number of checklists, open vulnerabilities and other groups of vulnerability counts. It also shows graphs on the total vulnerability counts by status and severity, POAM information, and checkist type pie chart.
This data can be seen on other tables in lists of data. However, the checklist data shown visually may be easier to digest for top level information, data calls and reports.