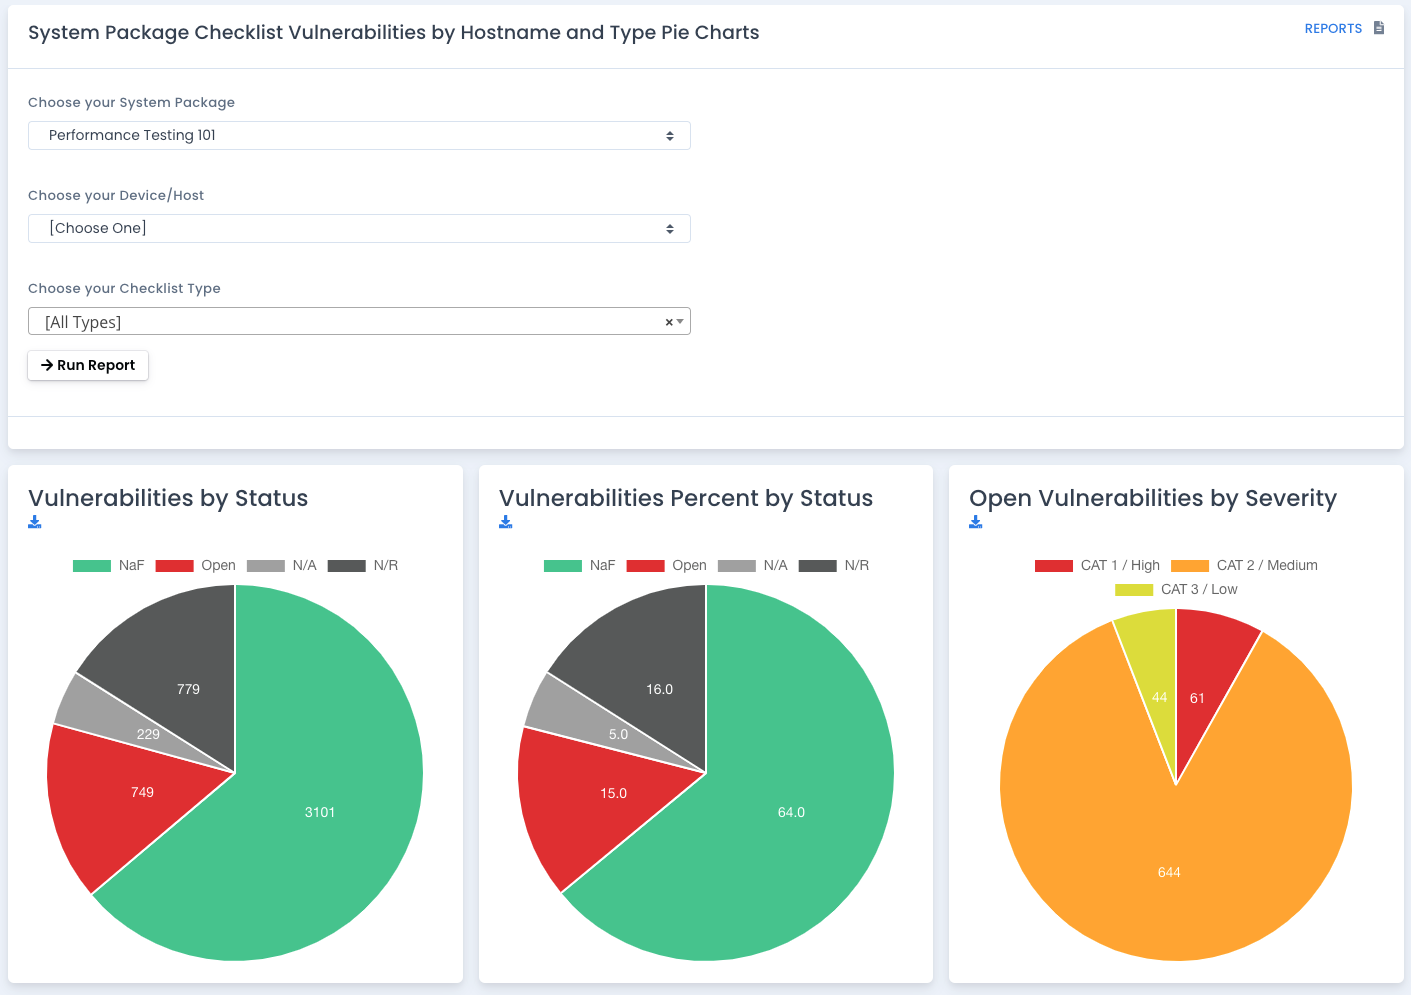
Run the Checklist Vulnerability by Severity and Status Pie Charts
This report shows you the breakdown of vulnerabilities by the status for total numbers and percentages overall. You can do it by total system package listing, by hostname, by type, or by hostname and type.
Where the Data Comes From
This data comes from all active checklists in your system package (i.e. you have not deleted them). Each checklist has a list of multiple vulnerabilities and their status as well as Category or Severity. That data is pulled from your checklists and put into the reporting database by vulnerability so reports like this can come back quickly and easily. As vulnerabilities are updated, they are versioned in the checklist database and the final data is parsed and updated in the vulnerability report database.
Why Run this Report
Use this report if you want to see the total number of vulnerabilities across your whole system package as a group visually. It shows you a percentage of them by status and breaks down visually all open vulnerabilities as well.