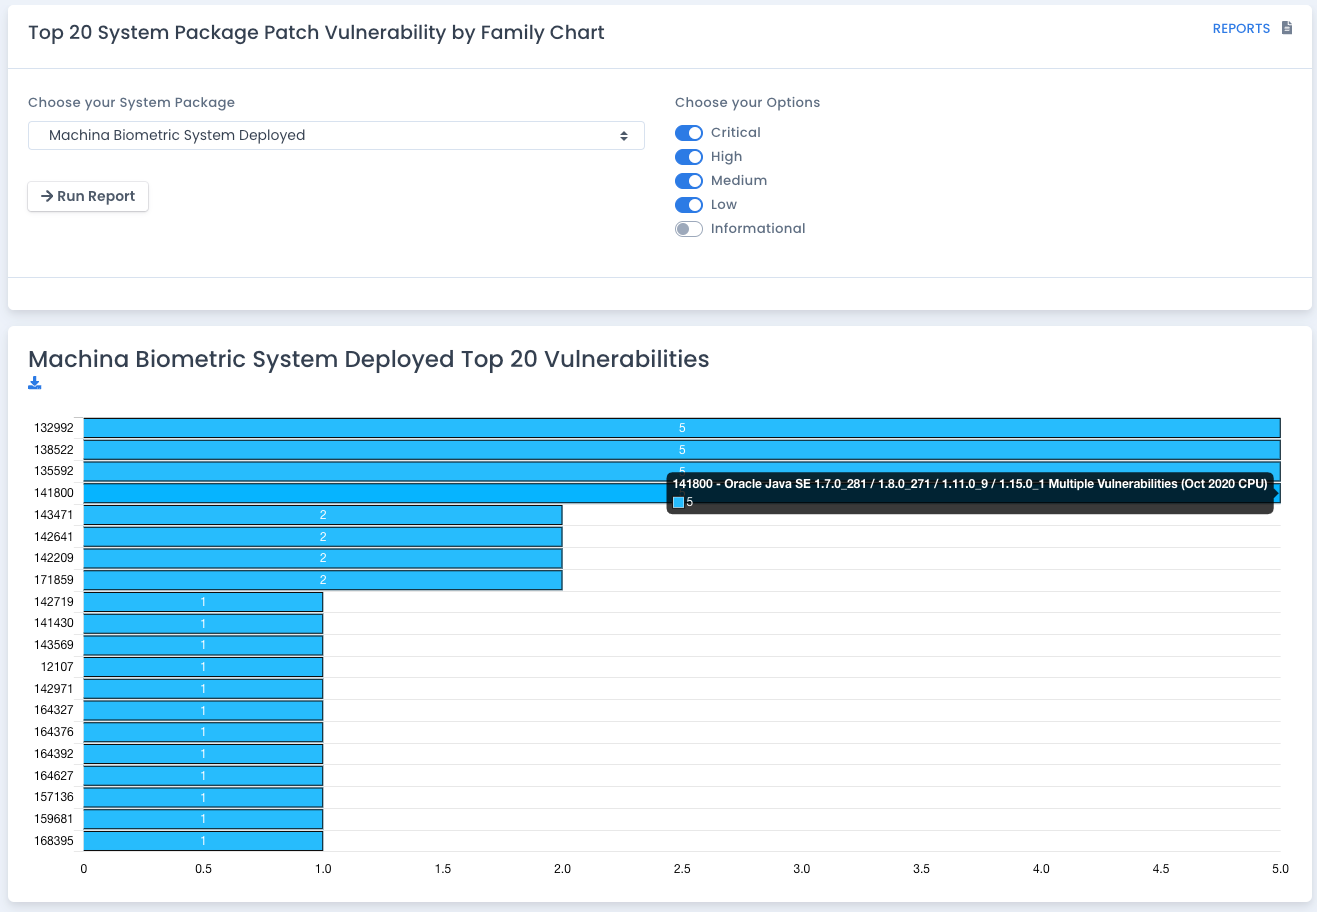
Run the Top 20 Patch Listing Chart
This chart shows a breakdown of the number of open patch vulnerabilities by the largest count across all devices in your system package. You can specify the types of vulnerabilities by severity to make the chart more specific.
Where the Data Comes From
This data is an accumulation of all patch scans uploaded into the system package area. It parses *.nessus credential patch scan results (or uncredentialed if allowed in System Package Preferences), Rapid7 Nexpose .xml patch scan results, or the .json generic patch vulnerability results and separates out all the plugin (patch) data and parses it to put into the patch scan database. It comes back sorted by severity (critical, then high, then medium, then low, then informational) so you can quickly see the impact and risk associated with all the patch data in the system package.
As you upload patch scan results it adds new plugin data, updates older ones, and updates the patch data score.
Why Run this Report
Find out the number of open patch vulnerabilities by vulnerability id / plugin id counts within your system package visually, showing the top 20 with the largest counts.