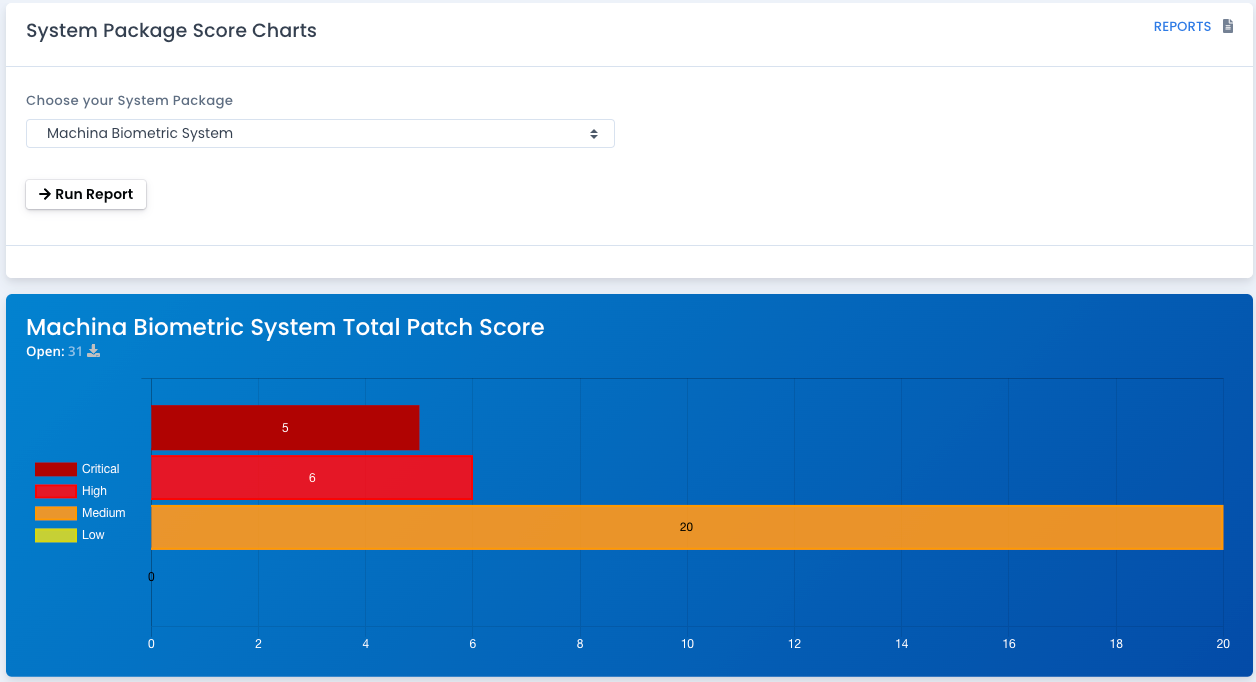
Run the Total Patch Score Chart
This chart shows the total patch score in chart format, broken down by the severity of the open patch vulnerabiltiy. You can click the download link to download the chart in JPG format.
Where the Data Comes From
This data is an accumulation of all patch scans uploaded into the system package area. It parses *.nessus credential patch scan results (or uncredentialed if allowed in System Package Preferences), Rapid7 Nexpose .xml patch scan results, or the .json generic patch vulnerability results and separates out all the plugin (patch) data and parses it to put into the patch scan database. It comes back sorted by severity (critical, then high, then medium, then low, then informational) so you can quickly see the impact and risk associated with all the patch data in the system package.
As you upload *.nessus files or .xml files it adds new plugin data, updates older ones, and updates the patch data score.
Why Run this Report
This report allows you to focus on just patch scan data visually and see the breakdown of open patch vulnerabilities by severity quickly.