Display Metrics with Grafana
The OpenRMF® Professional stack comes built-in with Prometheus to gather metrics and Grafana to display that data in charts and graphs.
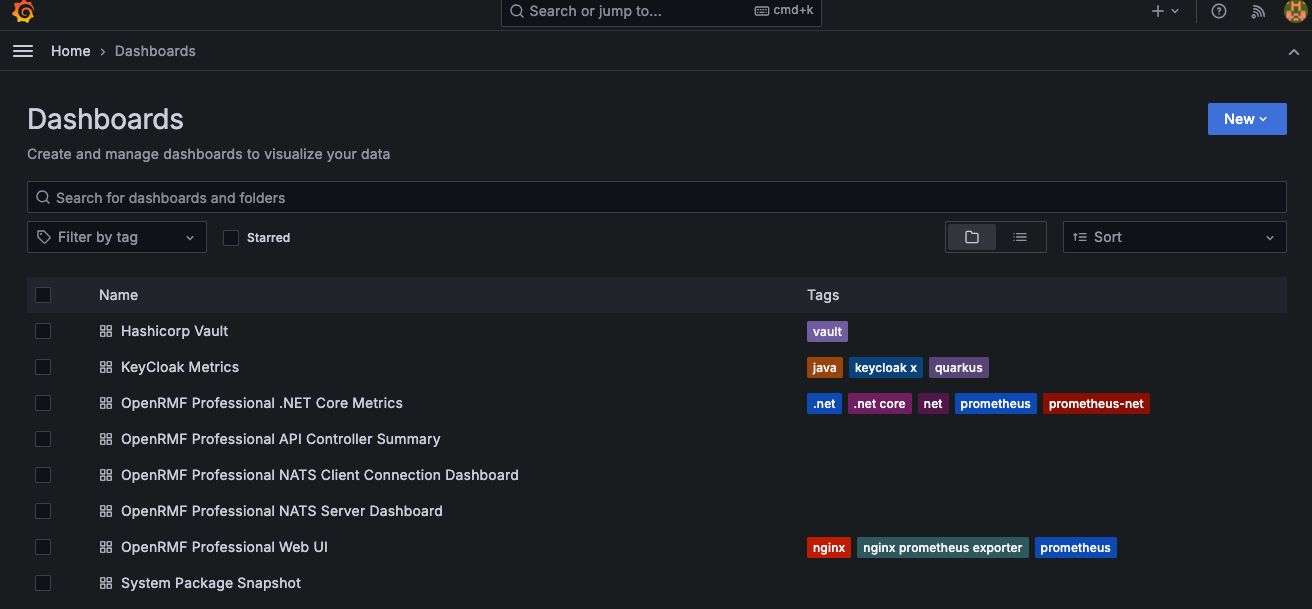
Pre-Configured Dashboards
The Grafana application is setup to run at the /metrics path on the server that the web portion of OpenRMF® Professional is set to run. There are 5 configured dashboards in Grafana. These can be updated or added to the included open source Grafana server. Or can be used in your corporate Grafana instance. The administrator login is setup in the stack configuration or at installation time.
Once logged into Grafana, you can click the Menu button in the top left and then click the Dashboard option. When that screen displays, click the General folder link to list all pre-defined metrics listings.
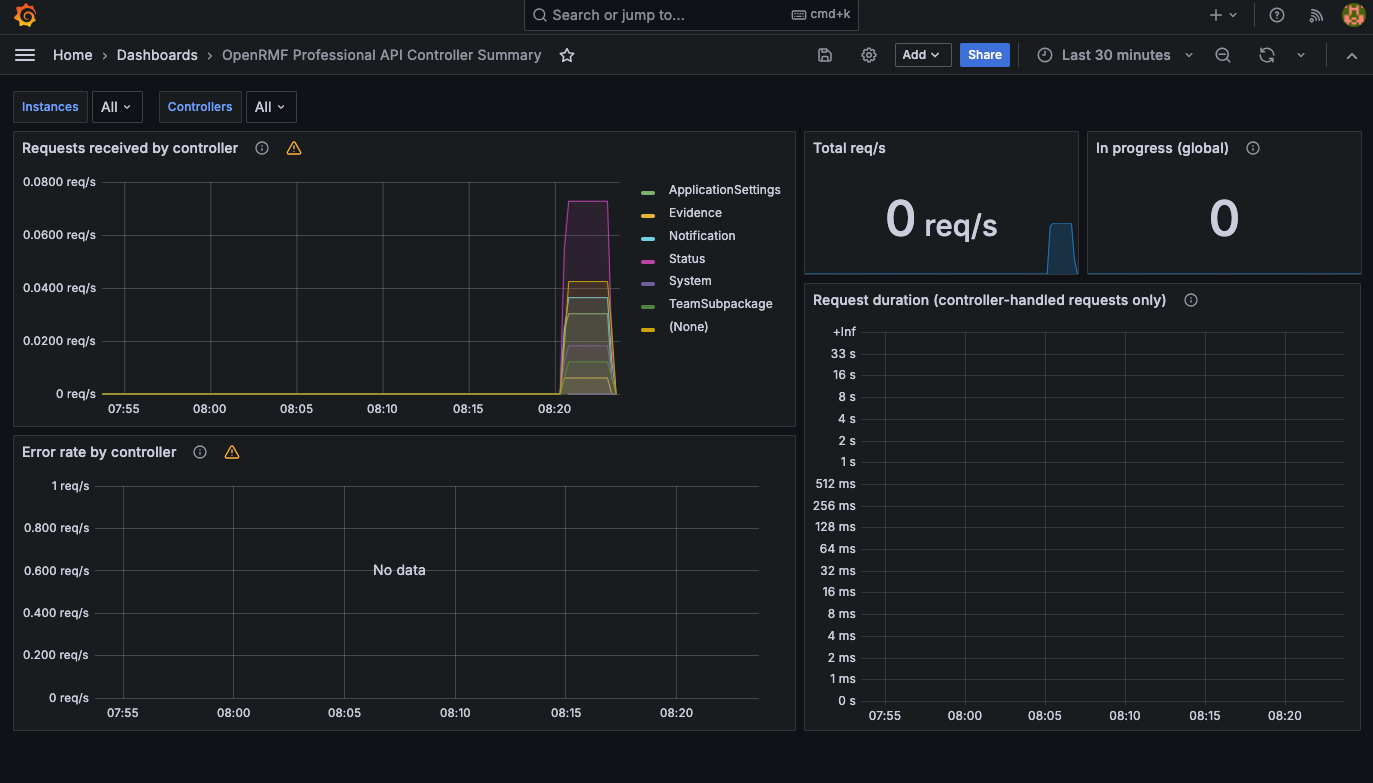
API Controller Summary
The API Controller dashboard shows API requests, duration, and error rate of API calls within OpenRMF®.
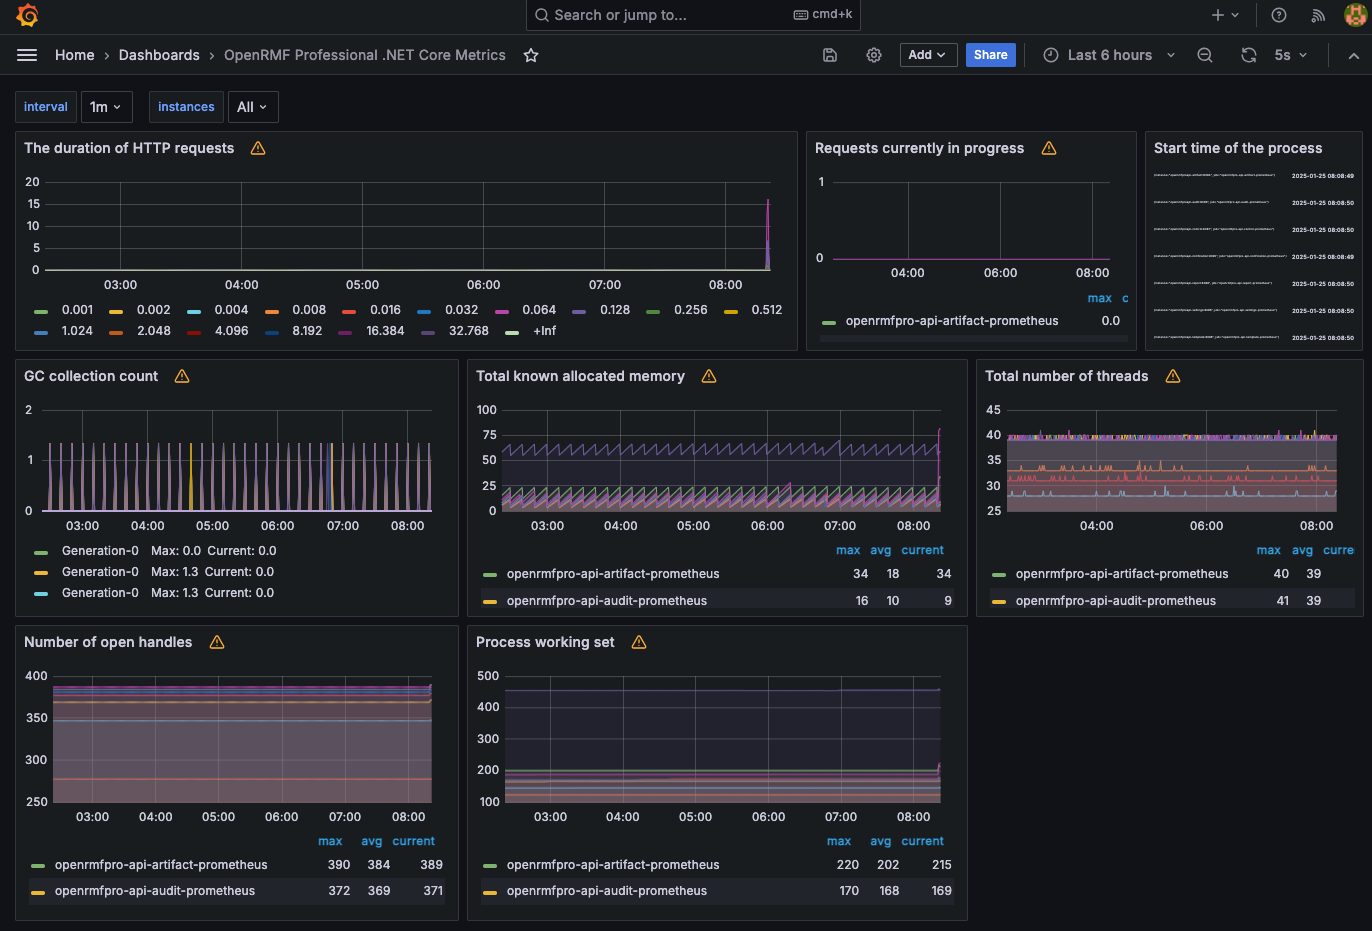
.NET Core Metrics
This dashboard shows the .NET Core 3.1 metrics of the APIs and message clients including memory usage, threads, processing, HTTP requests and the similar metrics.
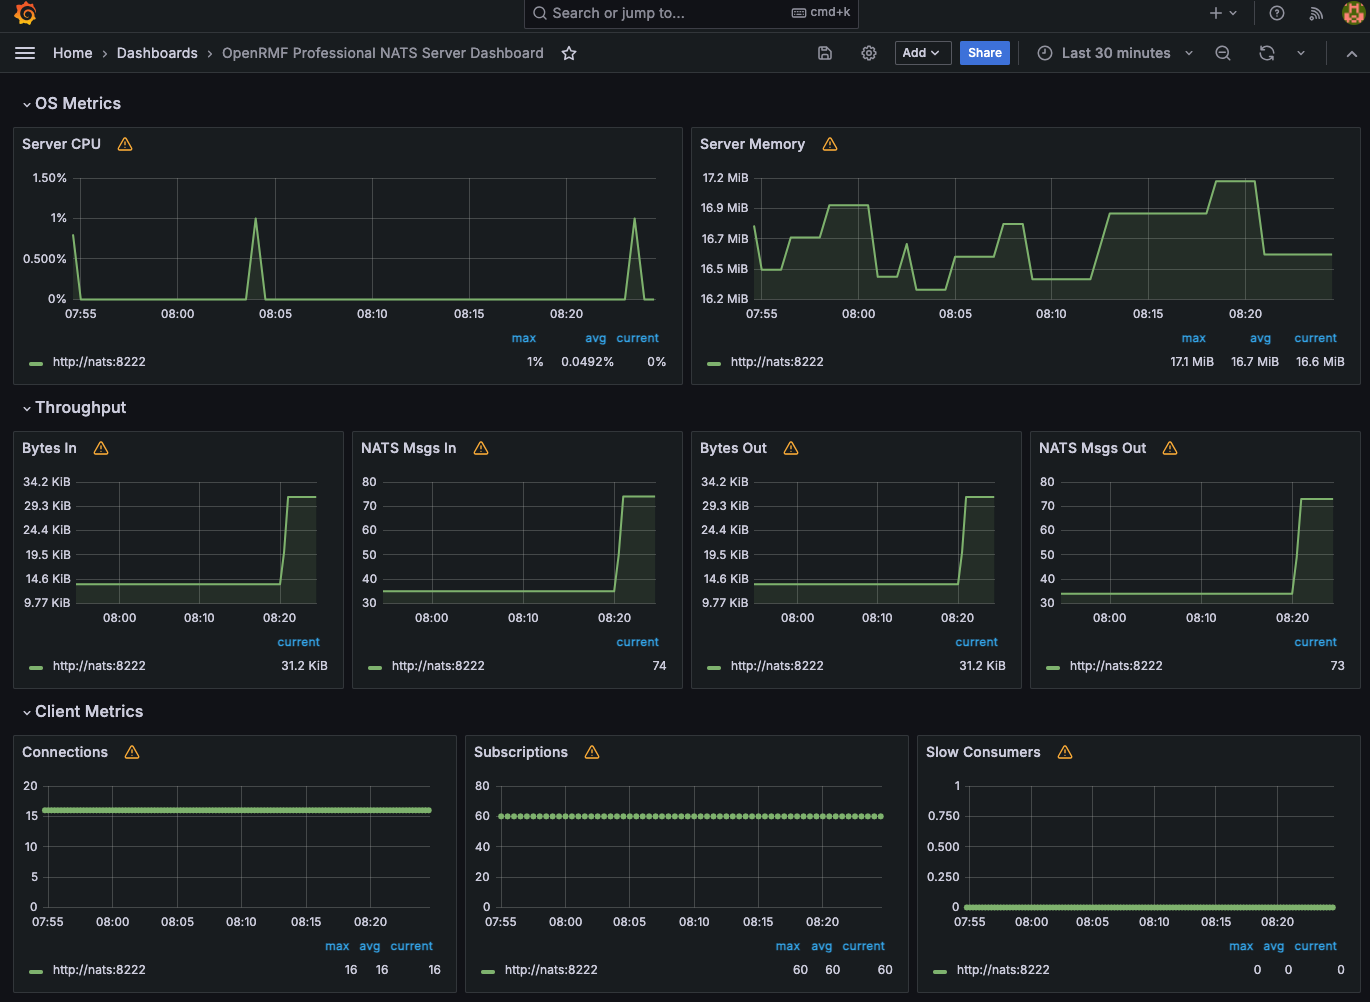
NATS Server
This shows total NATS message server input and output, connections, memory, and usage metrics. NATS is used as a messaging interface for API communication as well as eventual consistency within OpenRMF® Professional.
NATS Client Connections
This shows the NATS metrics for client connections used for inter-API communication. 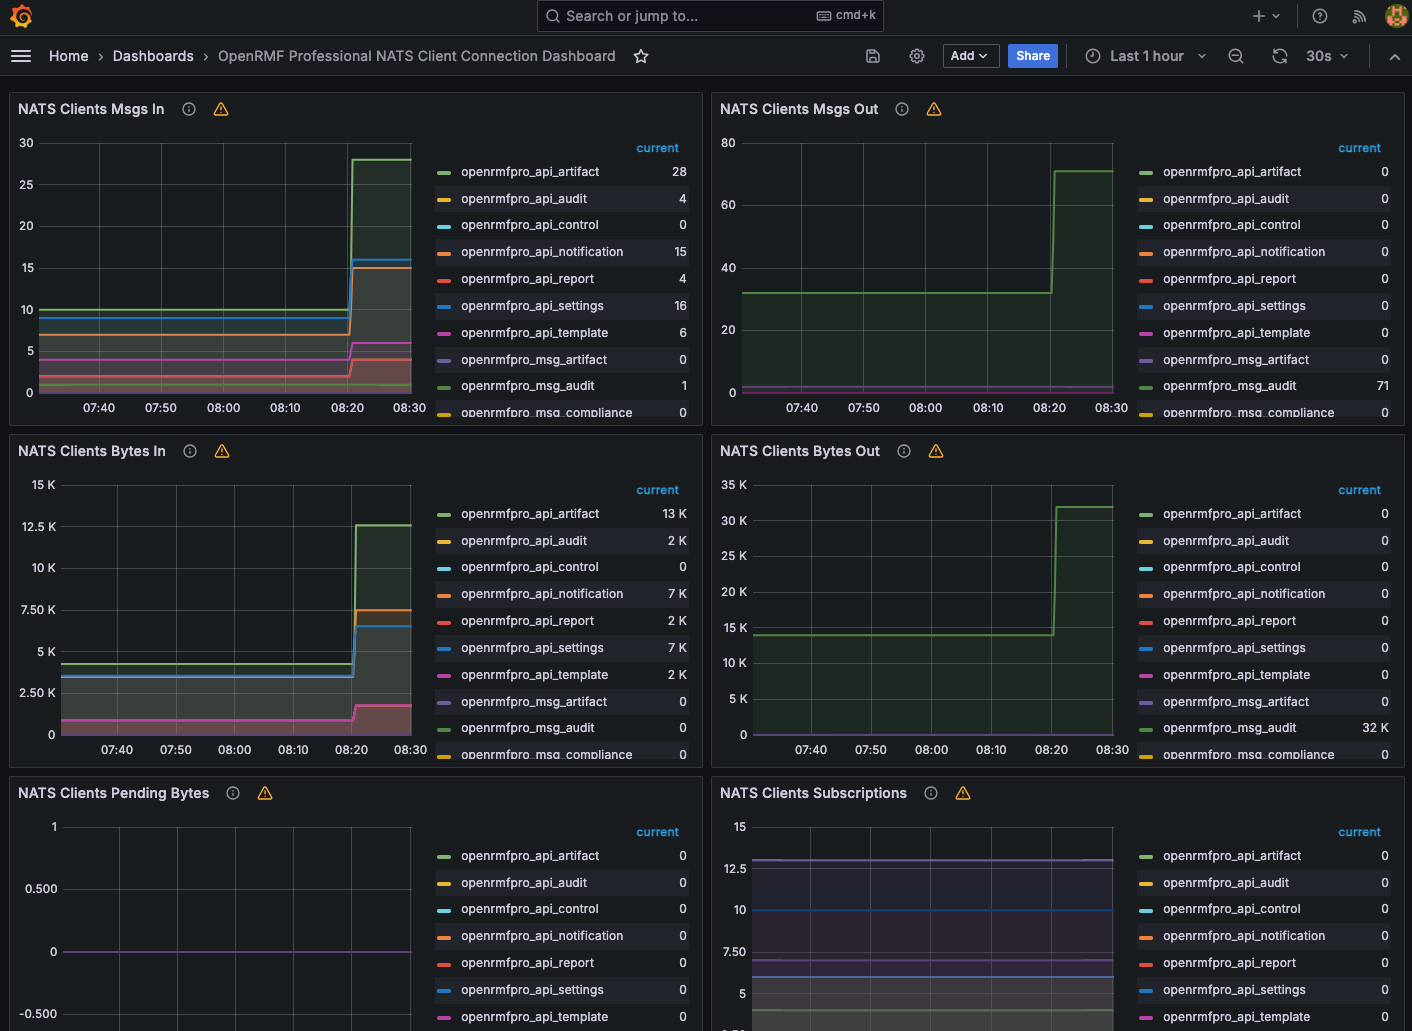
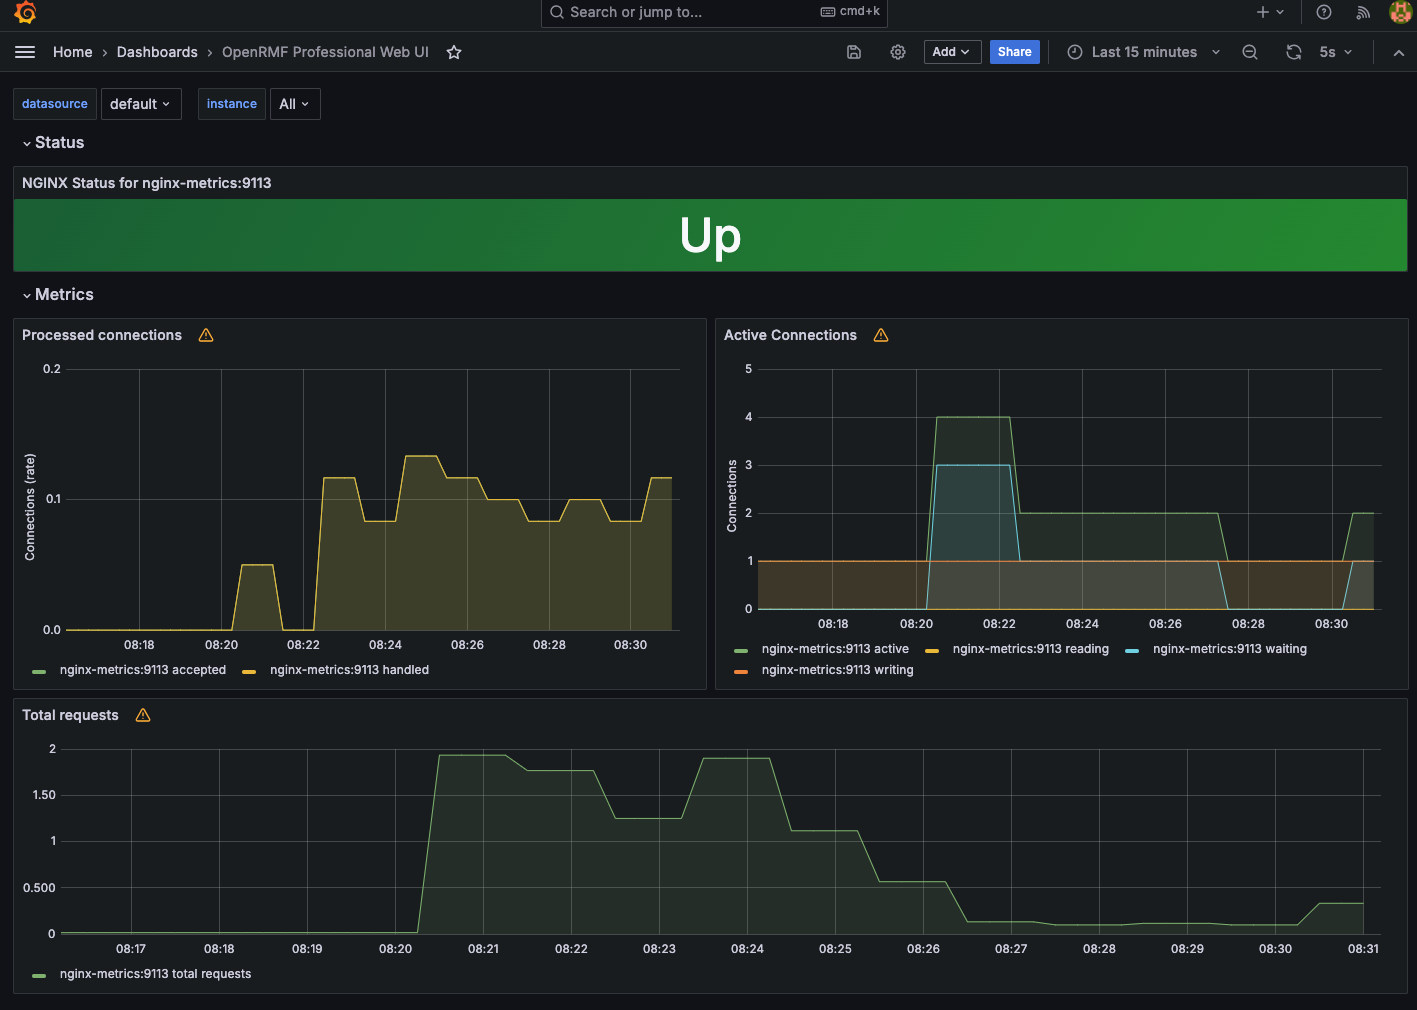
OpenRMF® Professional Web UI
This shows the metrics on the web server interface for pages of the application.
Hashicorp Vault
This dashboard to shows metrics of the Vault component used behind the scenes.

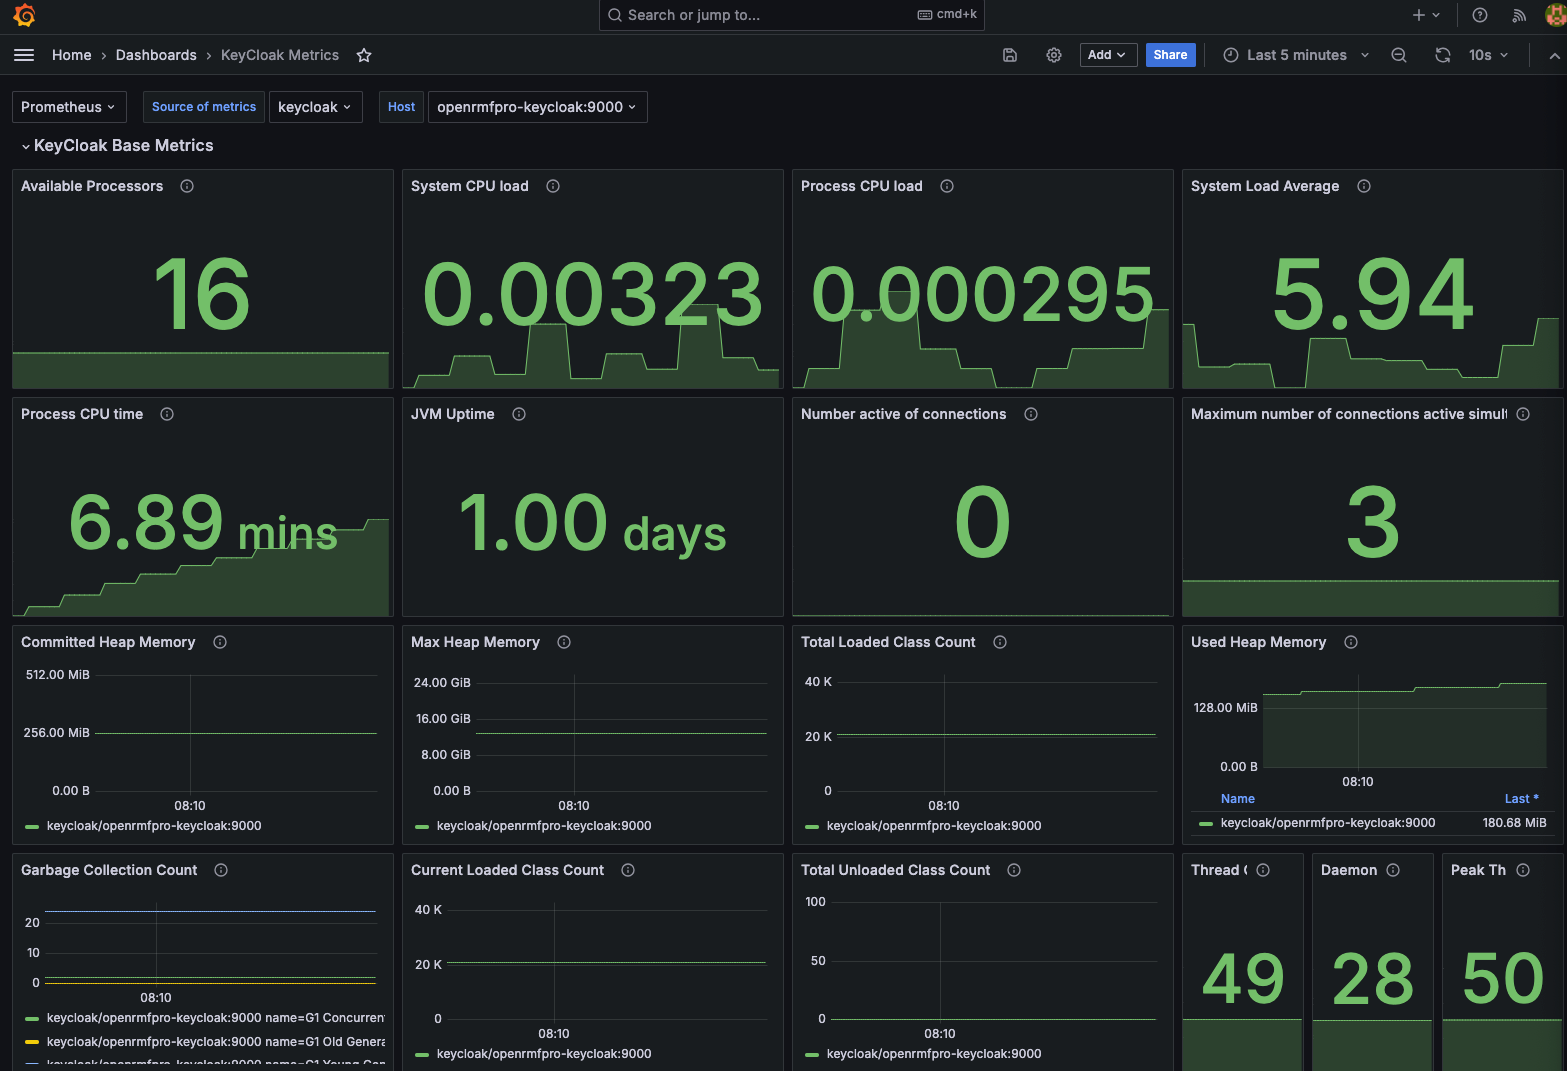
Keycloak
This dashboard shows metrics of the Keycloak authentication and authorization component.
Additional Chart: System Package Dashboard
There is an additional grafana dashboard setup as a template to use with some configuration. It uses the JSON API data source included in the OVAs and installation of the application. You can specify the URL to the system package as well as the API token from the External API setup in OpenRMF® Professional to use this dashboard.
The information to use this dashboard can be found on our GitHub public automation repository at https://github.com/SoteriaSoftwareLLC/openrmfpro-automation/tree/main/dashboards/systempackage.
Prometheus Metrics
The Prometheus configuration is setup to watch a /metrics endpoint on every single API. It also is setup to watch metrics on the NATS messaging server and individual NATS clients used for API-to-API communication.